A statistical follow-up to the Statehood Plebiscite
Click on the thumbnails to see larger image of each precinct.
1) Column 1 are the image details of the 1959 Electoral Precinct Maps. Click to enlarge, This will give you an accurate reading to see how each district voted in hte 1959 Statehood Plebiscite.
2) Data tallied in column 2 are the” yes“, “no” and total votes from each precinct on Proposition One of Hawaii’s Statehood Plebiscite (Should Hawaii become a state or remain a territory), as recorded by the Office of Elections in the June 27, 1959, “Results of Votes Cast.” Precinct boundaries are in accordance with the Governor’s Proclamation dated June 26, 1957.
3) Between July 28, 1959 and the 1960 Census, there is a population difference of 10,685 (1.69%) as the population jumped from 622,087 to 632,772. The population listed for each district and precinct are in column 3 and is from the 1960 Hawaii Census. The 1959 population figure is from the State of Hawaii Data Book. Except for Honolulu County, the Census County Division on each map corresponds to the Election Precinct Boundaries. The district details of the population data are based on the 1960 Census.
4) In 1959, the minimum voting age in Hawaii was 20 years and the population of those 20 and older was 360,193. The U.S. Statistical Abstract lists 348,000 as being eligible to vote in Hawaii. I’ve included an additional 11,863 to factor in those who were 20 years old in 1959 and excluded from the Abstract. In Column 4 of this study, I discount an average of 56.9% of the total population as being ineligible to vote. It should be noted that the Armed Forces are counted as residents in both the State of Hawaii Data Book and the Census. According to the Data Book, there were 183,118 registered voters and voter turnout was 171,383. At 57.9% of the population, I estimate a total of 360,193 as being eligible to vote. I should also note that due to the opposing directions that birthdates and the 1.69% population growth pull this data, the “+”or “-” variable should remain neglible.
5) According to the 1960 Census, 202,230 (32%) residents are identified as white or Anglo-American, while 425,599 (67%) residents are listed as non-white and 4.943(.8%) are identified as African-American. There is no accounting for indigenous native Hawaiians or Kanaka Maoli. In column 5, I have inserted the Anglo-American/non-white index to highlight discrepencies in the voting pattern. Unfortunately, this is the only index that is broken up by precincts. Other indexes such as place-of–birth, education, income, or veteran status only assigns data to the general counties of Hawaii, Maui, Oahu and Kauai.
6) Interpreting two different sets of data on Armed Forces residency from the State of Hawaii Data Book (105,898 & 112,425), I’m indexing an average of 109,162 military personnel and their dependents in Hawaii in 1959, the military contributing to 17.55% of the population. Out of that 56,303 are dependents who are also counted as residents.
| Column 1 | Column 2 | Column 3 | Column 4 | Column 5 |
| Precinct Maps | Yes+No Vote | Voter Eligibility | % in favor of statehood | Anglo/non-Anglo breakdown |
| Island Wide | Y + N =Total 132,773 + 7,971 =140,744 | 360,193* | 39.6% participated in vote 36.8 voted for statehood | 202,230 / 430,542 32% “white” 68% “non-white” |
| Precinct 1-5 | District yes+no=total on proposition 1 | Population of Counties by Census County Divisions, 1960. Eligibility to vote data based on District or County data of those 20 years and older and measuring the percentage against the larger population. | For voter eligibility, the population of each county is factored against those 20 years and older. The data estimates (~) resident population with voters from each precinct. | Anglo-American/Non-white/African-American |
| Precinct 1 | Hawaii First Representative District of the first Senatorial District 1. 33+16=49 2. 27+7=34 3. 84+5=89 4. 323+8=331 5. 103+13=116 6. 353+18=371 7. 246+11=257 8. 564+42=606 Total: 1,733 + 120 = 1,853 | Pahoa-Kalapana 1,326 Keaau Mountain View 3,704 Total population 5,030. 56% eligible to vote | ~2,836 eligible to vote, with 56% of precinct population voting. 59.50% in favor of statehood. | 780 / 4,248 16% white 84% non-white |
| Precinct 2 | Hawaii Second Representative District of the First Senatorial District 1. 276+36=312 2. 46+29=75 3. 24+2=26 4. 487+59=546 5. 32+4=36 6. 67+2=69 7. 548+40=588 8. 238+11=249 9. 351+16=367 10 589+23=612 11. 487+20=507 12. 417+26=443 13. 378+24=402 14. 688+61=749 15. 503+45=548 16. 196+5=201 17. 381+32=413 18. 401+23=424 19. 912+44=956 20. 293+12=305 21. 257+18=275 22. 319+27=346. Total: 10,644 + 612 = 11,256 | Hilo 25,966 Papikou-Wailea 5,587 Total 31,553 55% eligible to vote | ~17,613 eligible to vote, with 63% of precinct population voting. 60% in favor of statehood. | 6,343 / 25,210 20% white 80% non-white |
| Precinct 3 | Hawaii Third Representative District of the First Senatorial District 1. 129+10=139 2. 375+22=397 3. 198+5=203 4. 417+10=427 5. 70+1=71 6. 172+9=181 7. 571+34=605 8. 238+11=249 9. 122+1=123 Total: 2,268 +110 = 2,378 | North Hilo 2,493 Paahau Paauilo 2,324 Honoka’a Kukuihaele 2,897 Total 7,714 56% eligible to vote | ~4,350 eligible to vote, with 54% of precinct population voting, 52% in favor of statehood | 1,766 / 5,943 15% white 75% non-white |
| Precinct 4 | Hawaii Fourth Representative District of the Second Senatorial District 1. 503+16=519 2. 400+18=418 3. 18+6=24 4. 57+4=61 5. 294+12=306 6. 923+28=951 7. 368+23=391 8. 309+13=322 9. 21+2=23 Total: 2,893 + 122 = 3,015 | South Kona 4,292 Kau 3,368 Total 7,660 56% eligible to vote | ~4,320 eligible to vote, with 70% of precinct population voting. 67% in favor of statehood | 702 / 6,954 9% white 91% non-white |
| Precinct 5 | Hawaii Fifth Representative District of the Second Senatorial District 1. 276+36=312 2. 46+29=75 3. 24+2=26 4. 487+59=546 5. 32+4=36 6. 67+2=69 7. 548+40=588 8. 238+11=249 9. 122+1=123 Total: 1,835 + 189 = 2,024 | North Kohala 3,386 South Kohala 1,538 North Kona 4,451 Total 9,375 56% eligible to vote | ~5,287 eligible to vote, with 38% of precinct population voting 35% in favor of statehood | 1,311 / 8,064 14% white 86% non-white |
| Precinct 6 | Maui: Molokai, Lanai Sixth Representative District of the Third Senatorial District 1. 529+14=543 2. 9+2=11 3. 185+5=190 4. 568+33=601 5. 250+9=259 6. 174+7=181 7. 189+5=194** Total: 1,904 + 75 = 1,979 | West Molokai 2,514 East Molokai 2,230 Lanai 2,115 Total 6,949 41% eligible to vote | ~2,849 eligible to vote, with 69% of precinct population voting. 66% in favor of statehood | 396 / 6,454 6% white 94% non-whitekalawao county (kalaupapa) 50/229 18% white 82% non-white |
| **Note: There are 279 residents counted in the 1960 census in Kalaupapa (7), a district of Kalawao County, which is separate from Maui county. | ||||
| Precinct 7 | Maui Seventh Representative District of the Third Senatorial District 1. 308+ 23 = 331 2. 193+ 15= 208 3. 755+ 23= 778 4. 536+ 24= 560 5. 26+ 2= 28 6. 639+ 31= 670 7. 836+ 92= 928 8. 763+ 29= 792 9. 533+ 27= 560 10. 232+ 12= 244 11. 16+ 0= 16 12. 1448+ 62= 1510 13. 909+ 36= 946 14. 355+ 26= 381 15. 439+ 31= 470 16. 655+ 43= 698 17. 239+ 13= 252 18. 640+ 69= 709 19. 353+ 35= 388 20. 41+ 4= 45 21. 71+ 2 =73 22. 17+ 4= 21 23. 233 +26 =259 24. 19+ 0= 19 25. 21+ 5= 26 26. 46+ 3= 49 27. 491+ 42= 533 Total: 12,718 + 754 = 13,472 | Haiku-Pauwela 1,943 Hana 1,073 Kahului 4,223 Kihei 1,079 Kula 2,786 Lahaina 4,844 Makawao_Paia 5,680 Puunene 3,054 Sprecklesville 1,838 Waihee-Wakapu 2,228 Wailuke 6,969 Total 35,717 41% eligible to vote | ~14/643 eligible to vote, with 92% of precinct population voting 86% in favor of statehood | 6,919 / 28,782 19% white 81% non-white |
| Precinct 8-17 | For Oahu Total 500,409 57% eligible to vote | ~285,233 eligible to vote, with 34% of precinct populations voting 32% in favor of statehood | 178,861 / 321,548 36% white 64% non-white | |
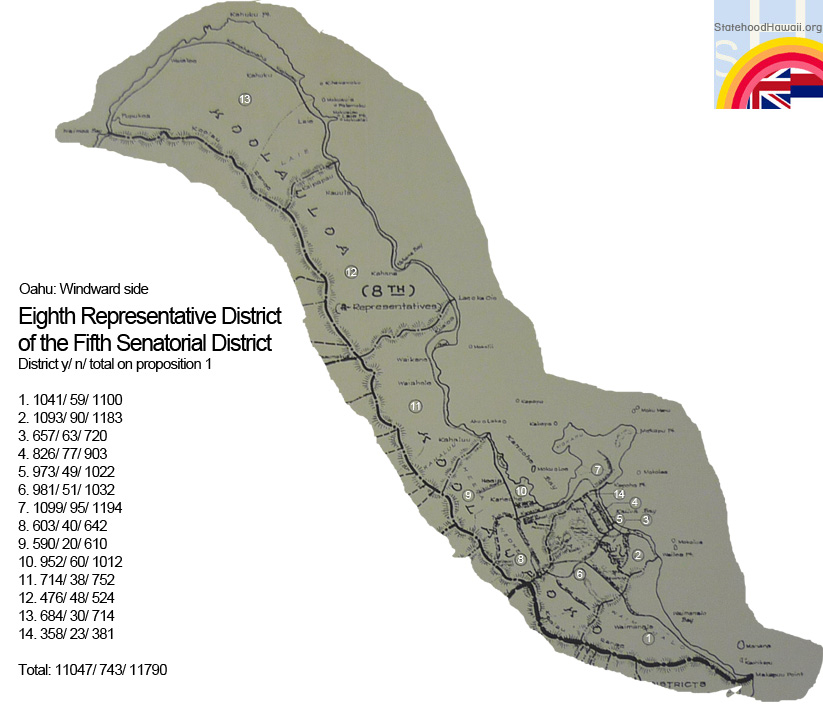
| Precinct 8 | Oahu: Windward side Eighth Representative District of the Fifth Senatorial District 1. 1041+ 59= 1100 2. 1093+ 90= 1183 3. 657+ 63= 720 4. 826+ 77= 903 5. 973+ 49= 1022 6. 981+ 51= 1032 7. 1099+ 95= 1194 8. 603+ 40= 642 9. 590+ 20= 610 10. 952+ 60= 1012 11. 714+ 38= 752 12. 476+ 48= 524 13. 684+ 30= 714 14. 358+ 23= 381 Total: 11,047 + 743 = 11,790 | Kailua-Lanikai 25,622 Kaneohe 14,414 Kahaluu 1,125 Kahuku 1,238 Laie 1,767 Waimanalo 3,011 Kaaawa 581 Hauula 806 Total 68,281 50% eligible to vote | ~34,140 eligible to vote, with 34% of precinct population voting. 32% in favor of statehood | 31,646 / 36,022 / 613 46% white 53% non-white 1% african-american |
| Precinct 9 | Oahu: WahiawaNinth Representative District of the Fifth Senatorial District 1. 643+51=694 2. 745+11=756 3. 1149+27=1176 4. 633+18=651 5. 933+35=968 6. 711+44=755 Total: 4,814 + 186 = 5,000 | Wahiawa 15,512 Haleiwa 2,504 Waialua 2,689 Waipio Acres 1,158 Whitmore 1,820 Total 42,816 55% eligible to vote | ~23,548 eligible to vote, with 21% of precinct population voting. 20% in favor of statehood | 21,417 /19,826 /1,373 41% white 45% non-white 14% african-american |
| Precinct 10 | Oahu: Halawa-Waianae Tenth Representative District of the Fifth Senatorial District 1. 702+30=732 2. 593+34=627 3. 944+33=977 4. 317+27=344 5. 1664+62=1726 6. 1125+23=1148 7. 757+17=774 8. 45+7=52 9. 490+29=519 10. 478+8=486 11. 385+8=393 12. 1135+58=1193 13.864+30=894 Total: 9,499 + 366 = 9,865 | Ewa 3,257 Ewa Beach 2,459 Nanakuli 2,745 Lualualei-Maile 5,045 Waianae-Makaha 6,844 Total 95,118 50% eligible to vote | ~47,559 eligible to vote, with 20% of precinct population voting. 20% in favor of statehood | 45,524 / 48,221 /1,373 48% white 51% non-white 1% african-american |
Honolulu Division The following population data is cumulative of all the precincts 11-17 (Honolulu). The 1960 census data does not corelate with boundaries of the inter-metropolitan districts. | ||||
| Precinct 11 | Oahu: Halawa-Kalihi Eleventh Representative District of the Fifth Senatorial District 1. 430+19=449 2. 824+40=864 3. 678+29=707 4. 1020+41=1061 5. 632+14=646 6. 873+39=912 7. 735+40=775 8. 513+25=538 9. 569+31=600 13.503+12=515 11. 642+38=680 12. 376+16=392 Total: 7,792 + 346 = 8,138 | Precinct 11-17 Honolulu 294,194 59% eligible to vote | Precinct 11-17 (71,439 voted) ~173,547 eligible to vote, with 41% of precinct population voting. 38% in favor of statehood | 108,833 / 242,503 31% white 69% non-white |
| Precinct 12 | Oahu: Kapalama-Nuuanu Twelfth Representative District of the Fifth Senatorial District 1. 605+39=644 2. 1103+35=1138 3. 820+17=837 4. 986+34=1020 5. 705+38=743 6. 592+29=621 7. 400+33=433 8. 218/17/235 9. 935+70=1005 10. 300+28=328 Total: 6,664 + 340 = 7,004 | |||
| Precinct 13 | Oahu: Kapalama -Sand Island -School St Thirteenth Representative District of the Fourth Senatorial District 1. 819+39=858 2. 661+48=709 3. 584+20=604 4. 659+27=686 5. 864+48=912 6. 560+21=581 7. 404+8=412 8. 488+9=597 9. 448+14=462 Total: 5,487 + 234 = 5,721 | |||
| Precinct 14 | Oahu: Iolaini Palace – Ala Moana Park – Auwaiolimu Fourteenth Representative District of the Fourth Senatorial District 1. 1192+115=1307 2. 497+16=513 3. 816+48=864 4. 397+27=424 5. 384+28=412 6. 450+27=477 7. 661+28=689 8. 407+25=432 9. 183+18=201 10. 363+31=394 11. 169+14=183 12. 388+14=402 13.973+25=998 14. 695+50=745 15. 687+22=709 16. 590+34=624 17. 721+57=778 18. 670+59=729 Total: 10,243 + 638 = 10,881 | |||
| Precinct 15 | Oahu: Ala Moana – Kapahulu – Manoa Fifteenth Representative District of the Fourth Senatorial District 1. 775+86=861 2. 737+60=797 3. 478+63=541 4. 736+51=787 5. 297+27=324 6. 1154+63=1217 7. 1182+29=1211 8. 622+8=630 9. 530+11=541 13. 669+25=694 11. 504+92=596 12. 654+92=746 13. 735+68=803 14. 506+54=560 15. 471+54=525 16. 574+22=596 17. 766+35=801 18. 709+51=760 19. 765+30=795 20. 788+23=811 21. 1102+15=1117 22. 405+8=413 23. 425+85=510 24. 437+62=499 Total: 16,021 + 1,114 = 17,135 | |||
| Precinct 16 | Oahu: Diamond Head – Palolo Sixteenth Representative District of the Fourth Senatorial District 1. 983+50=1033 2. 294+10=304 3. 572+24=596 4. 857+71=928 5. 889+39=928 6. 735+50=785 7. 1237+47=1284 8. 834+169=1003 9. 609+23=632 10. 468+6=474 11. 498+33=531 12. 416+8=424 13. 587+15=602 14. 606+6=612 15. 555+25=580 16. 831+39=870 Total: 10,971 + 615 = 11,586 | |||
| Precinct 17 | Oahu: Kahala – Hanauma Bay Seventeenth Representative District of the Fourth Senatorial District 1. 700+55=755 2. 955+44=999 3.779+56=835 4. 786+136=922 5. 76+13=589 6. 956+120=1076 7. 939+65=1004 8. 1044+106=1150 9. 588+50=638 10. 804+68=872 11. 312+37=349 12. 486+18=504 13. 568+61=629 14. 634+91=725 Total: 10,104 + 870 = 10,974 | |||
| Precinct 18 | Kauai/ Niihau Eighteenth Representative District of the Sixth Senatorial District 1. 18+70=88 2. 547+41=593 3. 685+40=725 4. 263+4=267 5. 469+23=492 6. 791+70=861 7. 1939+96=2035 8. 1689+110=1799 9. 124+8=132 10. 182+12=194 11. 191+17=208 12. 430+22=452 13. 682+51=733 Total: 8,017 + 562 = 8,579 | Eleele-Kalaheo 4,212 Hanalei 1,312 Kapaa 3,439 Kaumakani-Hanapepe 2,834 Kekaha-Waimea Koloa -Poipu 2,800 Lihue 4,106 Niihau 254 Puhi Hanamaulu 2,191 Wailua-Anahole 3,059 Total 28,176 58% eligible to vote | ~16,340 eligible to vote, with 52% of precinct population voting. 49% in favor of statehood | 5,102 / 23,074 18% white 82% non-white |
*In 1959, the voting age was 20+ and looking at census statistics for age, that significantly decreases the percentage from 60% (381,859) to 57% (360,193)–as demonstrated in the previous analysis– a difference of 21,166 eligible voters.
Data compiled and assembled by Arnie Saiki with the help of a grant from the Hawaii People’s Fund.
Sources: 1960 Hawaii Census,
“State of Hawaii Data Book,”
Official Tabulation “Results of Votes Cast”, Office of Elections
1961 U.S. Statistical Abstract, “Citizens and population of voting age,” pg 360, chart no. 484.
University of Hawaii at Manoa, Government Documents/Maps